Get started by installing pydeck.
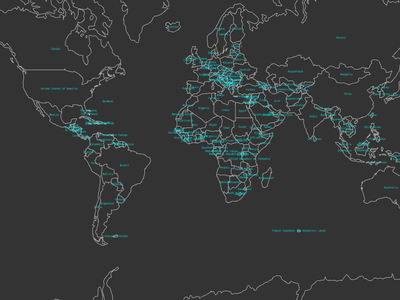
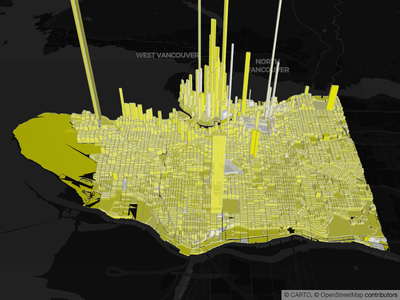
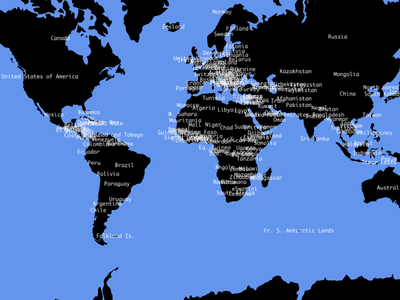
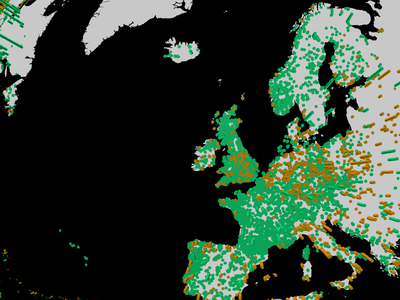
Gallery

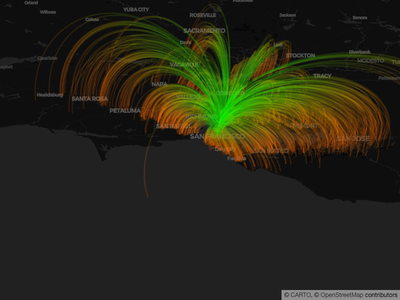
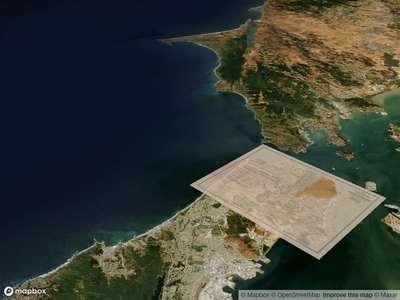
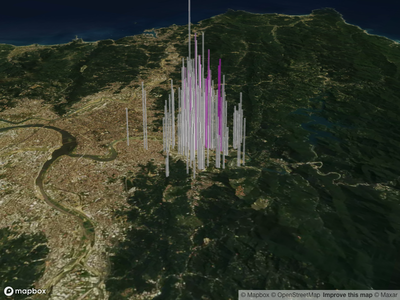
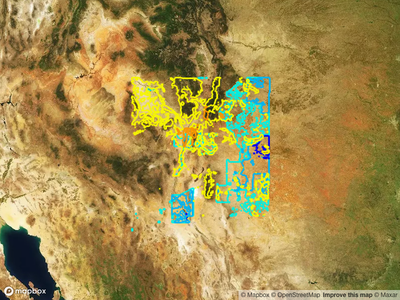
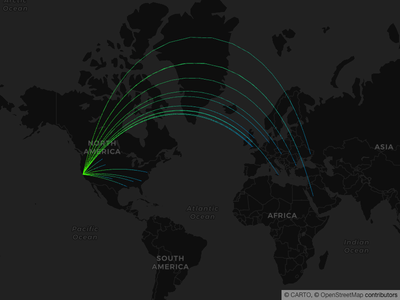
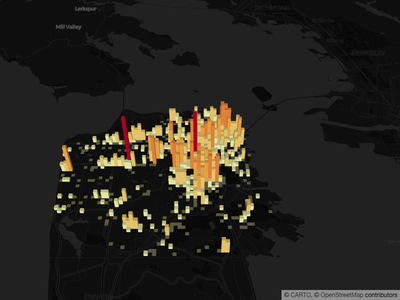
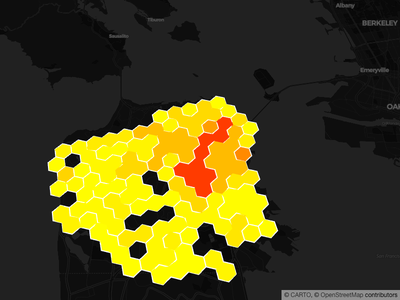
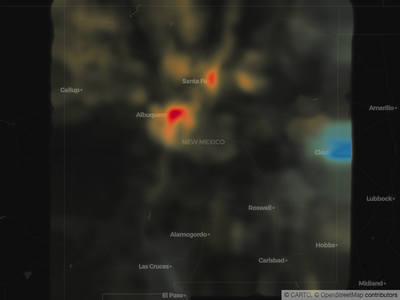
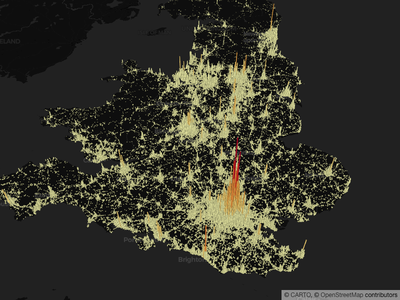
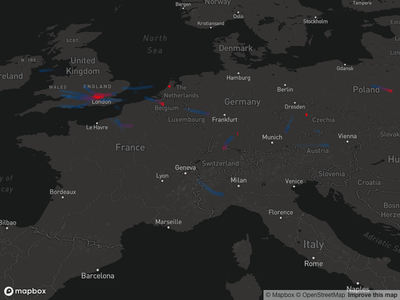

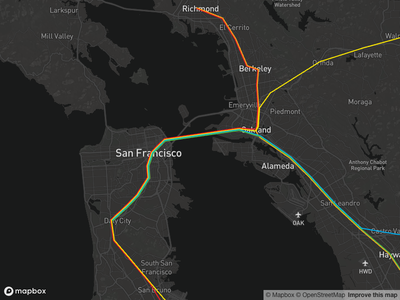
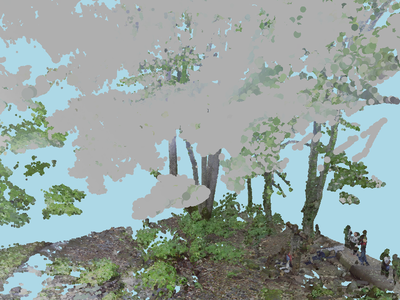
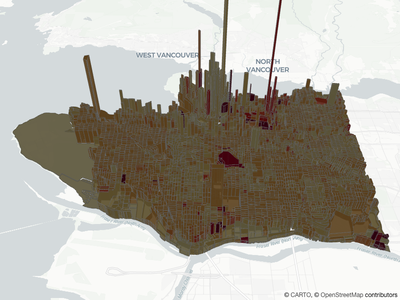
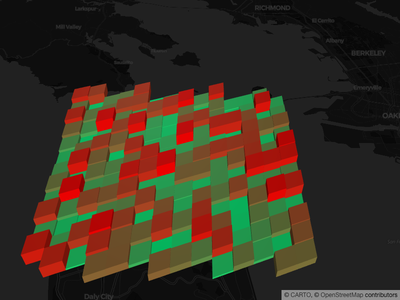
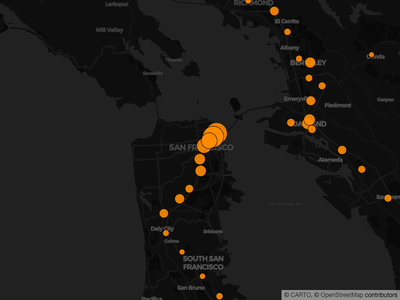


Overview
pydeck Playground
Try pydeck scripts directly in the browser with the pydeck playground. No installation needed — edit Python code and see the visualization update in real time.
pydeck in Jupyter
Uniquely integrated with the Jupyter ecosystem, pydeck supports interactions in a visualization that communicate with the Jupyter kernel. Read more about usage in Jupyter here.

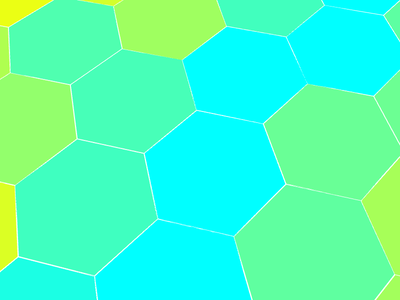
Conway’s Game of Life in pydeck
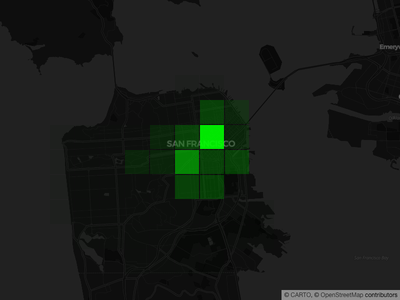
Layers
Configure one of the many deck.gl layers for rendering in pydeck.
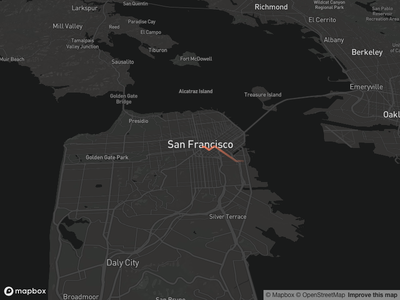
Deck
Better understand the main object within visualization, used to write data out to a widget in Jupyter, save it out to HTML, and configure some global parameters of a visualization, like its size or tooltip.
Data utilities
A handful of functions to make certain common data exercises easier, like automatically fitting a viewport to data on a map or quickly coloring categorical data
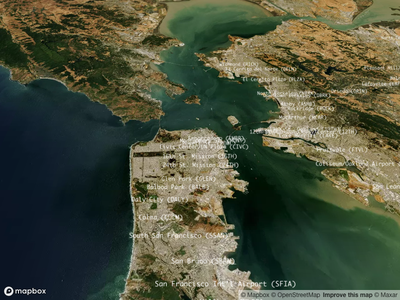
ViewState
Used to set the precise location of a user’s vantage point on the data, like a user’s zoom level
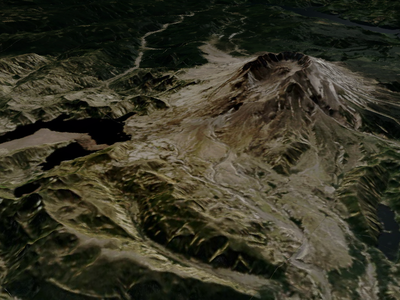
View
Used to enable or disable map controls and also modify the kind of map projection, like plotting in flat plane instead of plotting on a mercator projection
LightSettings (Experimental)
Configure the lighting within a visualization.
Widgets
Configure one of the many deck.gl UI widgets for displaying and controlling deck.gl state in pydeck.
Note
The pydeck library assumes Internet access. You will need an Internet connection or the visualization will not render.
Currently, pydeck will not raise an error on incorrect or omitted Layer arguments.
If nothing renders in your viewport, check your browser’s developer console
or review the layer catalog. You are encouraged to file an issue by clicking here
and mention pydeck in the title.
Index
Getting started
API documentation
Further customization
Development